Most companies say they’re “managing climate risk.” Fewer can explain which climate risk they mean, where it hits the business, and how they’ll quantify it without turning it into a science project.
Here’s the clean breakdown that works in real boardrooms: climate risk comes in two main flavours — Physical Risk and Transition Risk. They show up differently, move on different timelines, and require different controls.
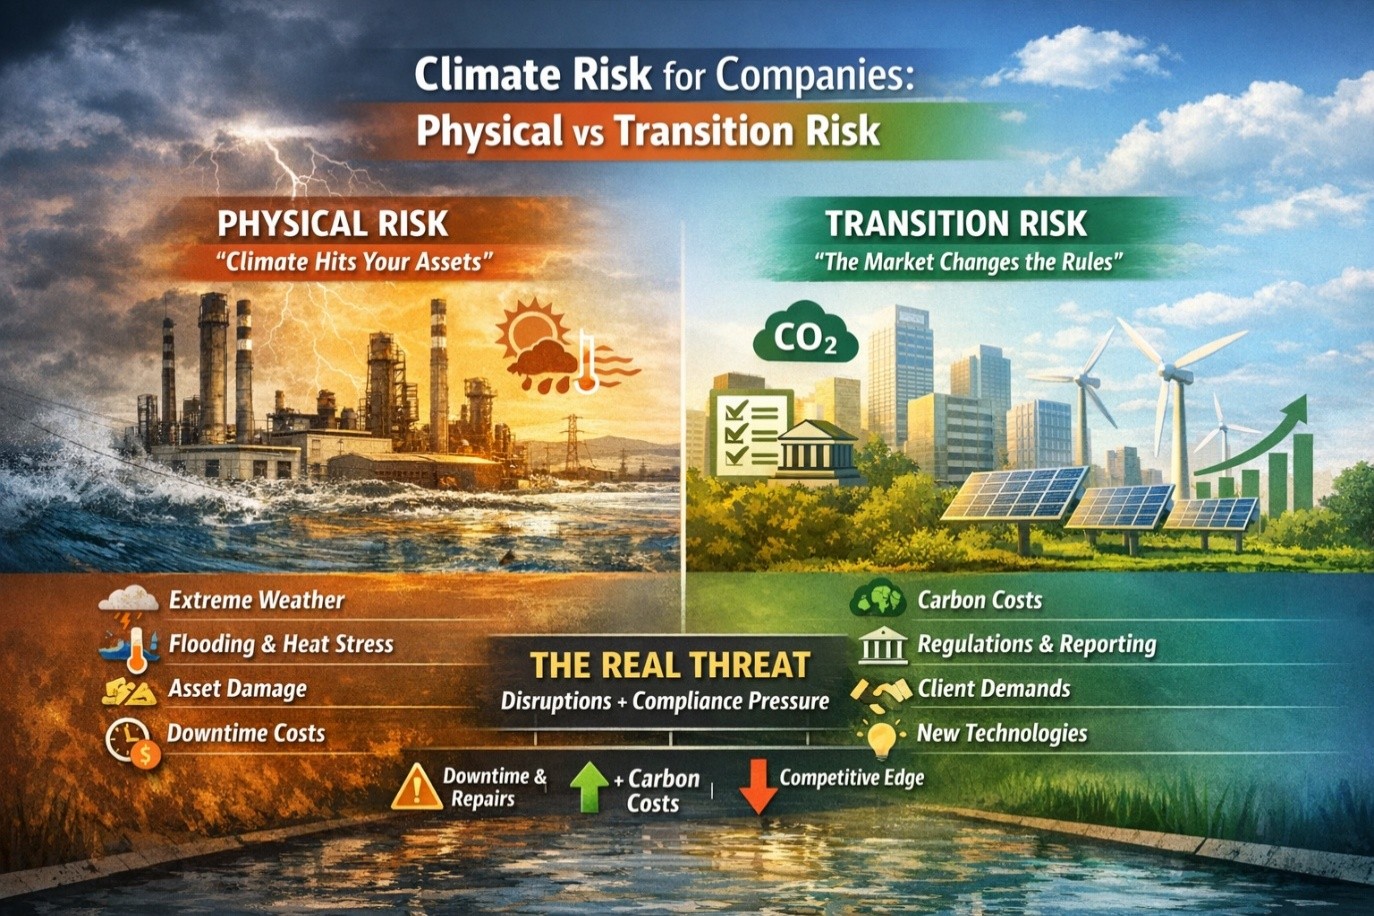
1) Physical Risk = “The climate hits your assets”
Physical risk is the direct impact of weather and climate patterns on your sites, people, equipment, and supply routes.
Two types:
- Acute physical risk: sudden events (flash floods, storms, heatwaves).
- Chronic physical risk: slow-burn shifts (higher average temperatures, sea level rise, water stress).
Where it hits (typical business impact):
- Safety & operations: heat stress, higher incident rates, stop-work triggers, productivity loss.
- Asset integrity: corrosion, HVAC overload, electrical failures, premature degradation.
- Business continuity: shutdowns, access issues, logistics disruption, extended recovery time.
- Insurance & financing: higher premiums, exclusions, tougher underwriting.
- Community & licence to operate: neighbour complaints, permit conditions, reputational damage.
Practical examples:
- A logistics operator faces route failures from flooding and storm surges.
- A manufacturing site sees output loss during peak heat due to cooling constraints.
- A developer absorbs CAPEX escalation because drainage design standards tighten after repeated extreme rainfall.
Early warning sign: you see climate impacts already in incident logs, downtime, maintenance costs, and overtime.
2) Transition Risk = “The market changes the rules”
Transition risk is the business impact of shifting policies, technology, investor expectations, and customer behaviour as the economy decarbonizes.
Key drivers:
- Policy & regulation: carbon pricing, disclosure mandates, building codes, product restrictions.
- Market & customers: procurement rules, low-carbon product demand, green building expectations.
- Technology: electrification, renewables, alternative materials, efficiency benchmarks.
- Finance & insurance: lending conditions, ESG covenants, cost of capital, insurer restrictions.
- Reputation & litigation: greenwashing risk, stakeholder pressure, legal exposure.
Practical examples:
- A contractor loses bids because clients require verified Scope 1–3 data and low-carbon materials.
- A real estate portfolio faces stranded asset risk when buildings fail energy performance thresholds.
- A manufacturer gets hit by supplier requirements (EPDs, recycled content, product carbon footprints).
Early warning sign: it shows up in procurement clauses, investor questions, tender requirements, and compliance costs — even before the weather hits.
Physical vs Transition: The no-nonsense comparison
Physical risk asks:
“Can we operate safely and reliably under future climate conditions?”
Transition risk asks:
“Will our business model remain competitive and compliant as expectations and rules tighten?”
A strong climate risk approach does both, because the real threat is often the combination:
- Physical disruption increases costs, while transition pressure limits your pricing power.
- New regulations force upgrades, while extreme weather makes downtime more frequent.
The practical workflow: how to assess without overcomplicating it
Step 1: Start with assets and value chain
List:
- sites, facilities, key equipment, warehouses
- critical suppliers and transport routes
- revenue-critical products/services
Step 2: Screen material hazards and drivers
- Physical: heat, flood, storm, water stress, sea level, dust/sand events (as relevant)
- Transition: carbon cost exposure, client requirements, technology shifts, disclosure obligations
Step 3: Score Likelihood × Impact (keep it consistent)
Use a simple scale (1–5) and define your criteria:
- safety impact
- downtime days
- repair cost
- revenue disruption
- compliance cost
- reputation/tender loss
Step 4: Convert to money (rough is better than fake precision)
A practical first pass:
- Downtime cost = daily gross margin × expected downtime days
- Damage cost = repair + replacement + expedited procurement
- Transition cost = compliance CAPEX + carbon cost + tender loss probability
- Insurance cost = premium increase + exclusions impact
Step 5: Assign owners and controls (this is where it becomes real)
For each top risk, define:
- preventive controls (design standards, maintenance, supplier requirements)
- detective controls (monitoring, audits, KPIs)
- response controls (BCP, emergency readiness, alternative suppliers)
- evidence (because “trust me” doesn’t pass assurance)
What “good” looks like in 90 days
If you want traction fast, aim for these outcomes this quarter:
- A clear list of top 10 physical risks and top 10 transition risks by asset/site/business line
- A basic cost range for each (low/expected/high) with assumptions stated
- A funded adaptation plan (physical) and decarbonization/market readiness plan (transition)
- Procurement clauses for key vendors: data + evidence + performance requirements
- A dashboard that executives can read in 60 seconds: RAG status, cost exposure, actions, owners
The bottom line
Physical risk is climate impacting your operations.
Transition risk is the economy reshaping your business.
Companies that win don’t debate definitions — they build a simple, evidence-based system that turns both into decisions, budgets, and accountable actions
LinkedIn version
Climate Risk for Companies: Physical vs Transition Risk (Practical Breakdown)
Most companies say they’re “managing climate risk.”
But in practice, they’re mixing two very different risk types:
1) Physical Risk = the climate hits your assets
This is direct disruption to operations from weather and climate patterns.
Shows up as:
- heat stress, safety stoppages, productivity loss
- flooding, storm damage, access issues
- equipment overload (cooling, power), premature asset failure
- insurance tightening + higher premiums
- downtime and repair costs
Quick reality check: if it appears in incident logs, maintenance tickets, or shutdown records — it’s physical risk.
2) Transition Risk = the market changes the rules
This is commercial + compliance pressure as the economy decarbonizes.
Shows up as:
- new reporting/disclosure requirements
- carbon costs, low-carbon procurement clauses
- client tender requirements (Scope 1–3, EPDs, verification)
- tech shifts (electrification, efficiency benchmarks)
- cost of capital / insurer restrictions
- reputational + greenwashing exposure
Quick reality check: if it appears in contracts, tenders, investor questions, or regulations — it’s transition risk.
The mistake: treating them as one bucket
They move on different timelines and need different controls.
Physical asks: “Can we operate safely and reliably under future conditions?”
Transition asks: “Will we stay compliant and competitive as expectations tighten?”
The real risk is the combo: more disruptions + less tolerance for inefficiency.
A simple workflow that works (no fancy models)
In 90 days, you can deliver:
- Asset list + critical suppliers/routes
- Top hazards/drivers (heat/flood vs policy/market/finance)
- Simple scoring: Likelihood × Impact (1–5)
- Convert to money (rough, honest ranges):
- downtime cost (daily margin × days)
- repair/replacement cost
- compliance + retrofit CAPEX
- tender loss / margin pressure
- Owners + actions + evidence (audit-ready)