1. The Paradigm Shift: From Externalities to Natural Infrastructure
The transition from viewing the environment as an “external issue” to recognizing it as “natural infrastructure” represents a strategic imperative for modern corporate governance. For too long, environmental economist models treated nature as an externality—a set of variables outside the core financial engine. However, as global supply chains face unprecedented systemic risk, leadership must internalize the reality that nature is the foundational infrastructure for long-term business continuity. This shift is not a matter of corporate social responsibility; it is a fundamental realignment of how we define and protect the natural capital that underpins all economic activity.
In this paradigm, we must distinguish between nature as “scenery” and nature as a “working system.” Scenery is an aesthetic amenity often disregarded in capital allocation; a working system is a complex biological engine that generates non-market flows of value, such as water purification and climate regulation. When nature is viewed as scenery, project planning focuses on minimizing visual disruption. When viewed as a working system, the focus shifts to maintaining the integrity of service flows that, if lost, would necessitate capital-intensive grey infrastructure replacements. This analytical pivot fundamentally alters how we assess Value at Risk (VaR) and long-term asset resilience.
The Fundamental Question
Traditional financial modeling asks: “What does this project cost today in terms of capital expenditure?”
Economic resilience requires we ask: “What non-substitutable natural services are we at risk of liquidating, and what is the NPV of the engineered systems required to replace them?”
By reframing the environment as high-functioning infrastructure, organizations can begin to quantify their reliance on specific categories of ecosystem services.
——————————————————————————–
2. Taxonomy of Ecosystem Services and Business Dependencies
To mitigate balance sheet volatility, leadership must employ a rigorous taxonomy to classify ecosystem services. Identifying these services allows a firm to map hidden value chains and pinpoint fragility points where natural capital degradation could lead to operational paralysis.
Supporting Services: The Foundation of Life These are the underlying natural processes that facilitate the generation of all other ecosystem services.
- Examples: Biodiversity, soil formation, nutrient cycling, habitat creation, pollination support, marine habitat integrity, and genetic diversity.
- The “So What?” Factor: These services are the primary drivers of ecological productivity. If supporting services like nutrient cycling or soil formation fail, the biological foundation of the entire value chain collapses, leading to an irreversible loss of system-wide stability.
Provisioning Services: The Tangible Natural Capital These represent the material outputs and raw inputs extracted from ecosystems for production and consumption.
- Examples: Fresh water, food (crops and livestock), timber, medicinal resources, fibers, fish populations, raw materials, and genetic resources.
- The “So What?” Factor: A decline in these flows manifests as resource scarcity, extreme price volatility, and supply chain exposure. When provisioning services are compromised, the direct cost of inputs escalates, threatening the fundamental viability of manufacturing and extraction industries.
Regulating Services: Nature as a Control System These services act as the environment’s management system, maintaining the stability of operational conditions.
- Examples: Climate regulation, air purification, water filtration, flood control, erosion control, pest regulation, carbon storage, temperature moderation, and pollution breakdown.
- The “So What?” Factor: Loss of these “control systems” forces organizations to internalize the costs of environmental volatility. Without natural flood control or air filtration, companies must invest in expensive, energy-intensive engineered solutions to maintain basic operational safety.
Cultural Services: Socio-Economic Value and Attractiveness These are the non-material benefits that contribute to human well-being and regional economic health.
- Examples: Recreation, tourism, mental well-being, education, landscape identity, and heritage.
- The “So What?” Factor: Degradation of cultural services erodes the economic attractiveness of a region, negatively impacting property values, workforce retention, and community acceptance, which are critical for the long-term “social license to operate.”
Industry-Specific Dependencies
| Industry | Critical Provisioning Services | Critical Supporting Services |
| Agriculture | • Reliable fresh water • Food and crop outputs • Genetic resources | • Soil formation and health • Pollination support • Nutrient cycling |
| Construction | • Raw materials (stone, sand) • Timber and fibers | • Stable land for development • Habitat creation (for site offsets) |
| Manufacturing | • High-volume fresh water • Natural inputs and fibers • Raw minerals | • Water cycle maintenance • Waste breakdown and cycling |
Recognizing these industry-specific dependencies is the essential precursor to a formal impact assessment, shifting environmental management from a compliance exercise to a strategic risk function.
——————————————————————————–
3. The Economic Logic of Ecosystem Protection
Environmental degradation is a leading indicator of financial and operational risk. Because ecosystem services are frequently “invisible” in traditional accounting, they are consistently undervalued until a trigger event occurs. Triggers such as acute resource scarcity, spikes in insurance premiums due to increased vulnerability, and tightening regulatory exposure make these costs visible, often with a sudden and negative impact on the balance sheet.
Ecosystems function as a sophisticated “Control System,” providing services that are often more efficient and cost-effective than their engineered counterparts. The economic logic of preserving natural infrastructure is clear when comparing natural vs. grey solutions:
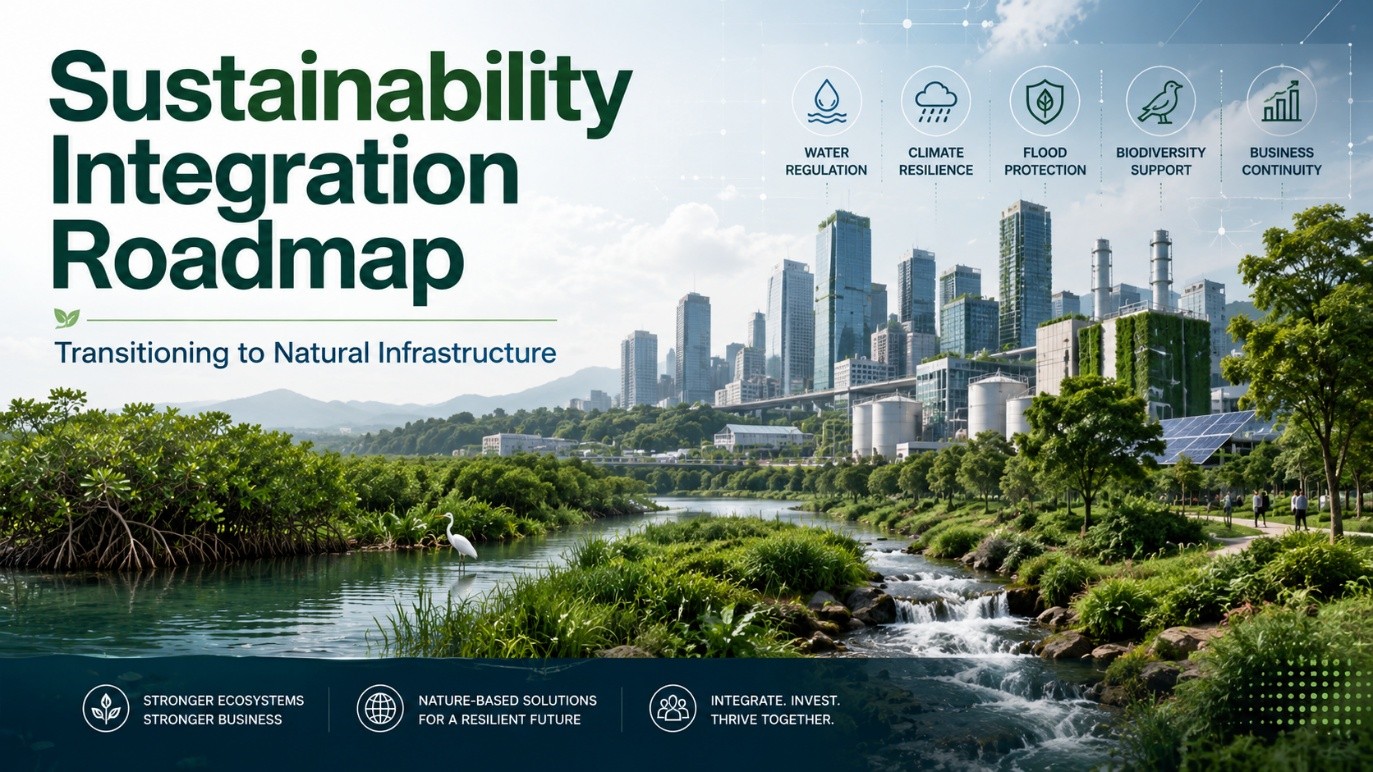
- Flood and Storm Risk: Coastal mangroves and wetlands act as a natural buffer against storm surges; destroying them necessitates massive investment in artificial levees and drainage, which lack the self-healing properties of nature.
- Climate and Pollution: Mature tree canopies and vegetation provide temperature moderation and air filtration, reducing the energy demand and capital expenditure required for mechanical cooling and filtration systems.
- Hydrological Stability: Healthy soil and natural drainage patterns manage water retention and groundwater recharge more effectively than artificial reservoirs.
A project may look financially robust on a short-term pro-forma, but if it undermines local drainage patterns or coastal protection, it creates significant long-term risk. This economic reality requires a transition to an operational roadmap that prioritizes the preservation of these high-value assets.
——————————————————————————–
4. Operationalizing the Roadmap: Mapping and Assessment
To navigate the complexities of natural capital, organizations must adopt a data-driven approach to mapping their dependencies. This allows the firm to identify systemic vulnerabilities before they manifest as operational failures or insurance cost spikes.
The Mapping and Assessing Phase
- Identify Dependencies: Quantify the business’s reliance on water, soil integrity, biodiversity, climate stability, and natural materials. This defines the firm’s “Natural Capital Footprint.”
- Review Operational Impacts: Analyze how construction, procurement, and waste management affect local ecosystems. Map the “pollution pathways” and land-use changes to understand the scope of the firm’s environmental impact.
Strategic Priorities for Asset Protection The roadmap mandates the protection of high-value natural assets to prevent the irreversible loss of ecosystem service flows. Organizations must prioritize the Avoidance of damage to:
- Wetlands and Coastal Buffers: Critical for natural storm protection and flood mitigation.
- Drainage Patterns and Groundwater Recharge Areas: Essential for maintaining regional water security and preventing land subsidence.
- Mature Trees and Biodiversity-Sensitive Zones: Necessary for temperature regulation and the maintenance of supporting services.
Failure to protect these assets directly correlates with increased insurance costs and asset devaluation. Once the assessment is complete, the focus shifts to the active management of these impacts through the mitigation hierarchy.
——————————————————————————–
5. Implementation: The Mitigation Hierarchy Framework
The Mitigation Hierarchy is a tiered strategic framework designed to discipline environmental management. It is a strict sequence of priority; circumventing the earlier tiers to reach “offsetting” is a failure of both strategy and economics.
- Avoid: This is the most cost-effective tier. By choosing to preserve biodiversity corridors or groundwater areas, a company avoids the high CAPEX of replacement and the systemic risk of service loss.
- Minimise: Where land disturbance is unavoidable, the focus must be on reducing the footprint and intensity of the impact to the lowest possible level.
- Restore: If damage occurs, there must be a rigorous commitment to restoration, with clear KPIs to track the return of ecosystem service flows.
- Offset: Offsetting is a last resort to compensate for residual impacts. It should never be treated as a primary strategy.
Analytical Consequences Circumventing the “Avoid” phase exacerbates long-term financial exposure. Bypassing early-stage mitigation erodes the very natural infrastructure—such as soil quality and drainage—that ensures project stability. From an economist’s perspective, many forms of natural capital are non-substitutable; once destroyed, the flow of value is lost permanently. Skipping these tiers undermines long-term viability and increases the probability of catastrophic “tail risks.” This hierarchy must therefore be integrated into formal governance structures.
——————————————————————————–
6. Governance, Monitoring, and Reporting Integration
For a roadmap to drive meaningful change, ecosystem services must be embedded into corporate oversight. Accountability is achieved only when natural capital is tracked with the same rigor as financial capital.
Governance Checklist
- Environmental Impact Assessments (EIA): Ensure the evaluation of ecosystem service flows is a mandatory component of project approval.
- Climate Risk Reviews: Integrate nature-based risks, such as the loss of coastal mangroves, into all climate resilience modeling.
- Procurement Decisions: Assess the supply chain’s impact on provisioning and supporting services as a criterion for vendor selection.
- Alignment with Standards: Ensure all natural capital data is compatible with international sustainability reporting frameworks.
Measure and Monitor Requirements Tracking performance requires specific metrics that reflect the functional health of the ecosystem:
- Pollution Pathways: Mapping the movement of waste and emissions through local air and water systems.
- Restoration Performance: Monitoring the actual success rate and biological recovery of restored habitats over time.
- Resource Intensity: Tracking water use, land disturbance, and habitat condition relative to output.
Conclusion Ecosystem services are not a discretionary “nice to have” for corporate branding; they are the foundational infrastructure for economic resilience. When nature is permitted to function as a working system, many operational risks remain mitigated and invisible. When nature fails, the costs of that failure become visible, immediate, and potentially ruinous. Transitioning to a model that internalizes the value of natural infrastructure is the only viable strategy for navigating a resource-constrained future